Statistics has a reputation for wearing a lab coat, carrying a clipboard, and making perfectly normal people whisper, “I was told there would be no math.” But the good news is this: once you understand the mean, standard deviation, and standard error, you can read data with much more confidence. These three numbers tell a surprisingly complete story. The mean tells you where the center of your data lives. The standard deviation tells you how spread out the data is. The standard error tells you how precise your sample mean is as an estimate of a larger population.
In plain English, if your data set were a group of friends walking into a restaurant, the mean would be the table they sit at, the standard deviation would show how far everyone wanders from that table, and the standard error would tell you how confidently you can say, “This table represents the whole group.” Not bad for three formulas that look scarier than they actually are.
This guide explains 5 ways to calculate mean, standard deviation, and standard error, including hand calculation, spreadsheets, calculators, grouped data, and programming-style workflows. You will also see examples, common mistakes, and practical experience notes that make the topic easier to apply in school, business, research, surveys, health data, marketing analytics, and everyday decision-making.
Before You Calculate: What Do Mean, Standard Deviation, and Standard Error Mean?
Mean: The Center of the Data
The mean, often called the average, is calculated by adding all values in a data set and dividing by the number of values. If six students scored 12, 15, 15, 17, 18, and 21 points on a quiz, the mean is:
(12 + 15 + 15 + 17 + 18 + 21) / 6 = 98 / 6 = 16.33
So the average score is about 16.33. The mean is useful because it gives a quick summary, but it can be pulled upward or downward by extreme values. A billionaire walking into a coffee shop can raise the “average net worth” of everyone inside, but that does not mean your latte suddenly comes with a yacht.
Standard Deviation: The Spread of the Data
The standard deviation measures how far data points typically fall from the mean. A small standard deviation means the values are clustered closely together. A large standard deviation means the values are more spread out.
There are two common versions:
- Population standard deviation: Used when your data includes every member of the group you care about.
- Sample standard deviation: Used when your data is only a sample from a larger group.
For most real-world projects, you use the sample standard deviation because you usually do not measure an entire population. Researchers, marketers, teachers, and analysts often work with samples because measuring everyone is expensive, slow, or impossible.
Standard Error: The Precision of the Mean
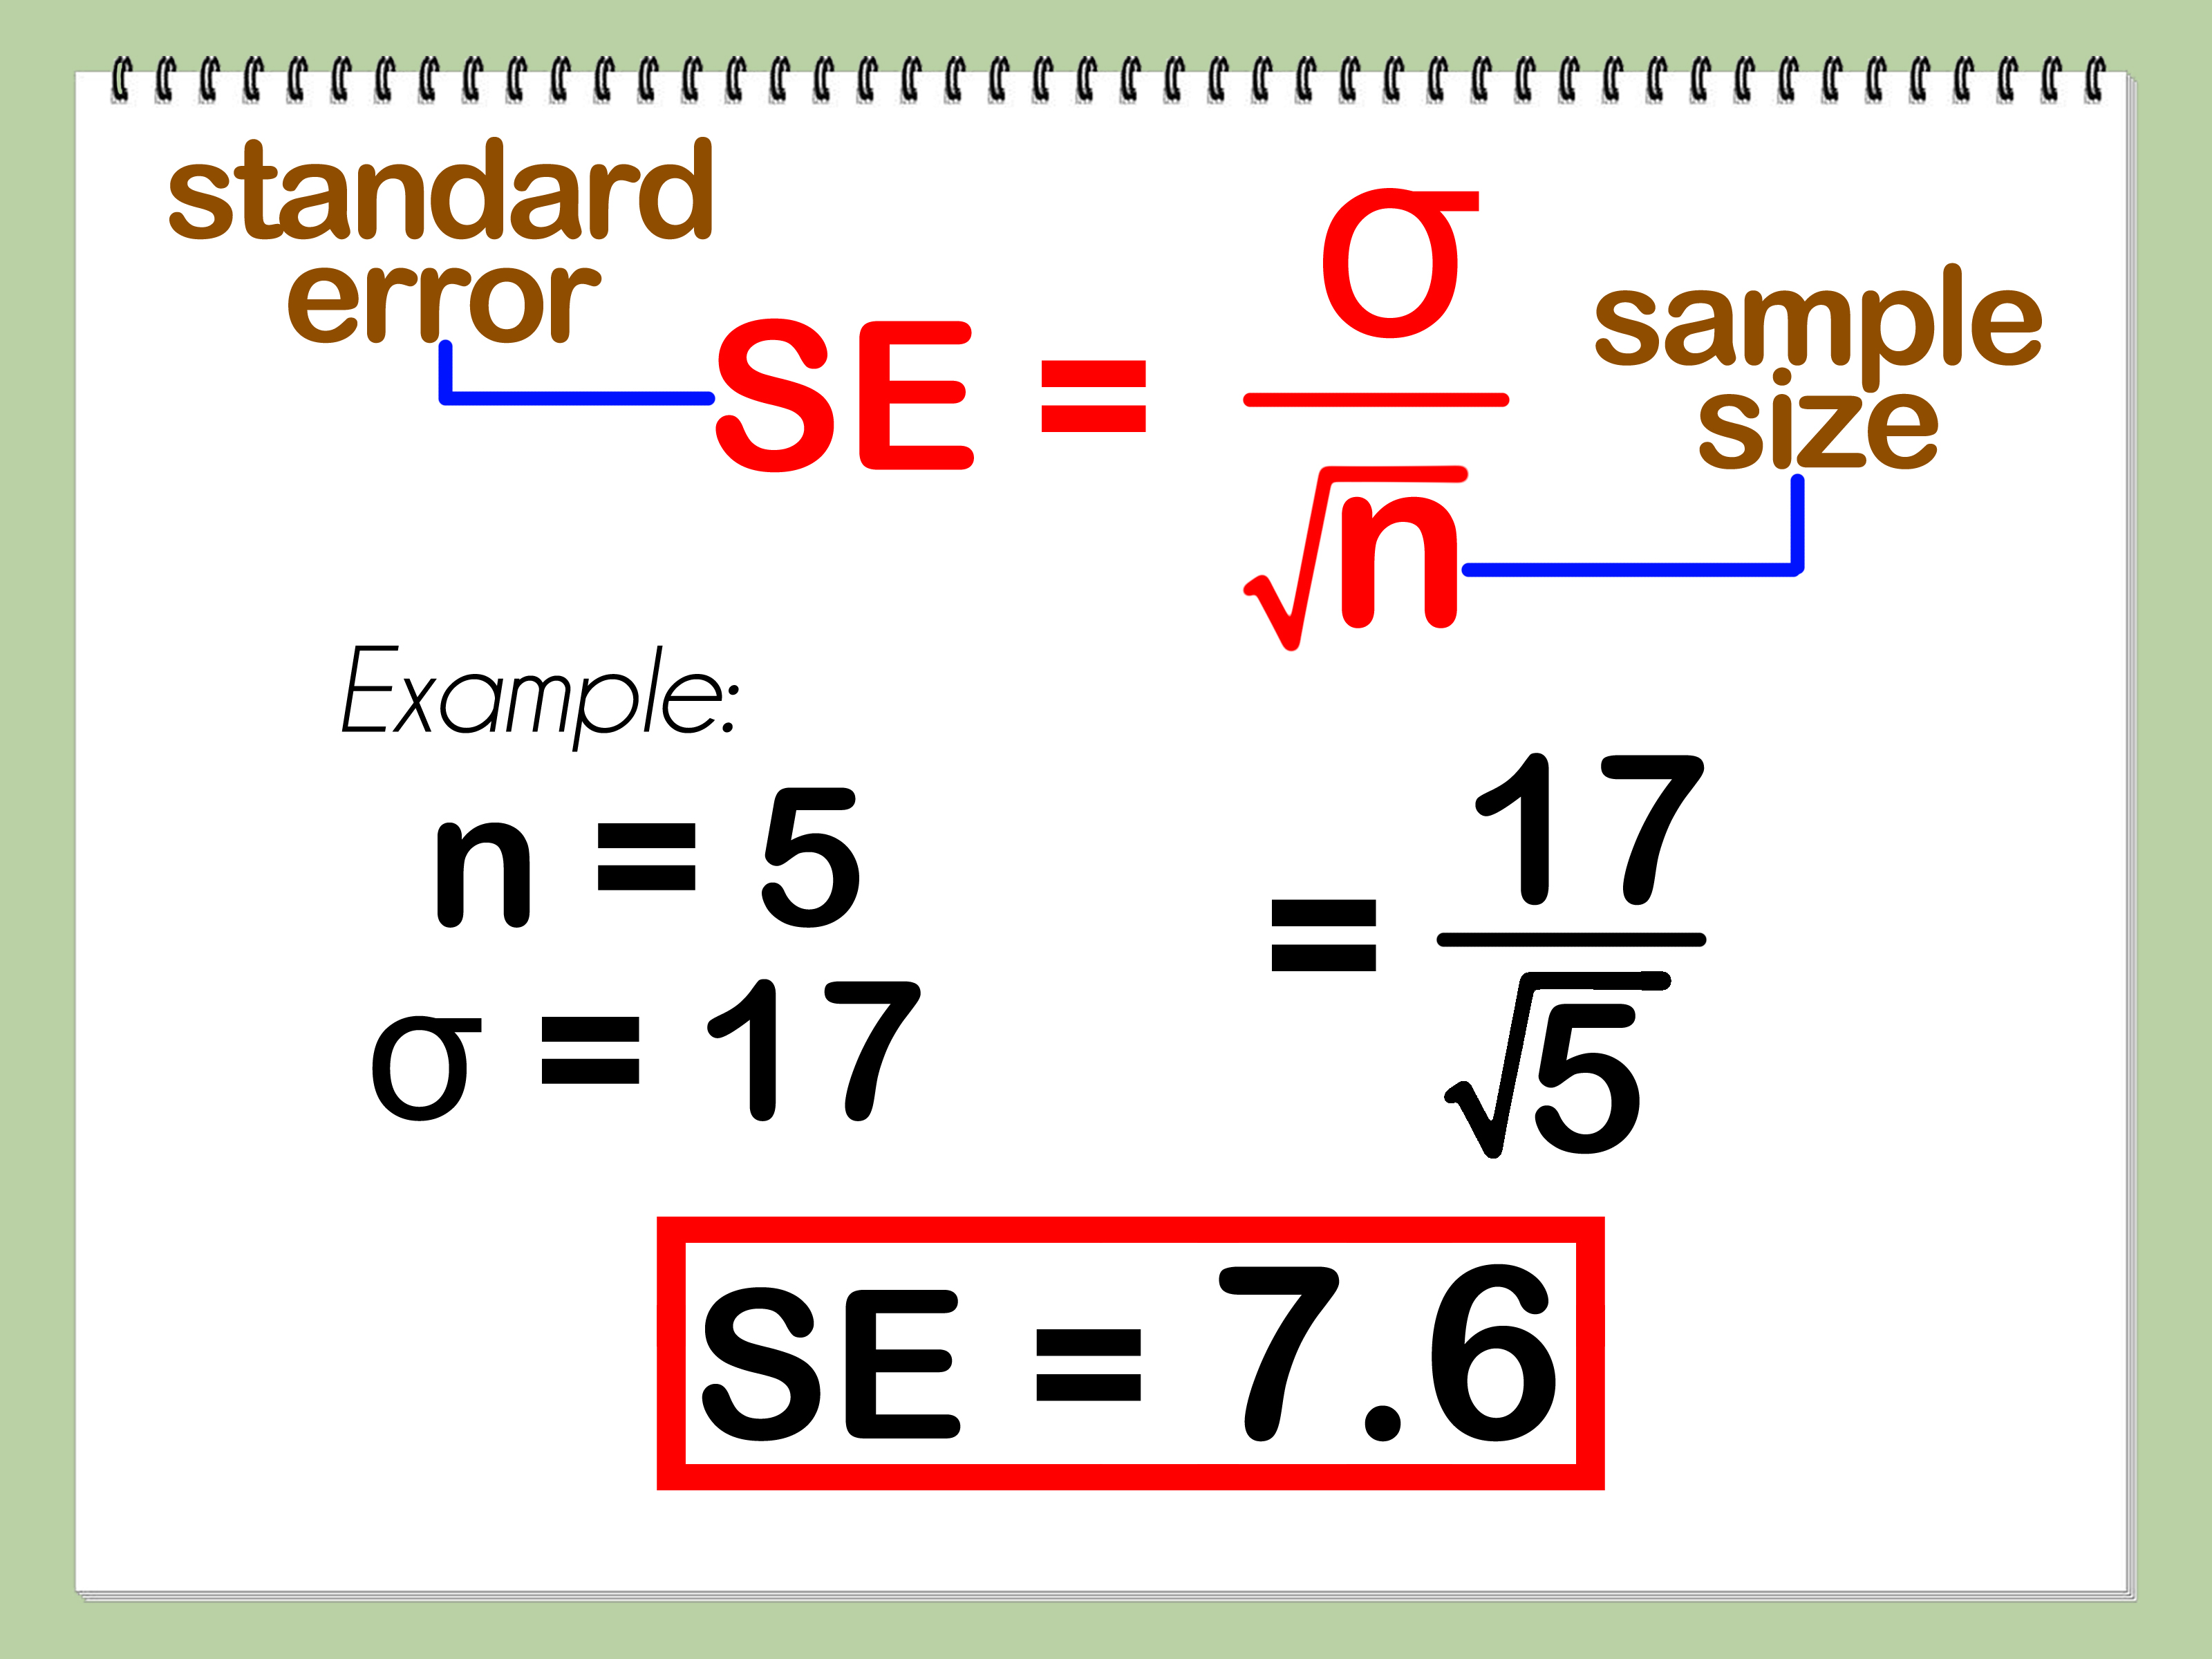
The standard error, often written as SE or SEM when referring to the standard error of the mean, estimates how much your sample mean would vary if you repeatedly took new samples from the same population. It is calculated as:
Standard Error = Sample Standard Deviation / Square Root of Sample Size
Or more compactly:
SE = s / √n
Here, s is the sample standard deviation and n is the sample size. A smaller standard error means your sample mean is likely to be a more precise estimate of the population mean. In general, larger samples produce smaller standard errors, assuming the spread of the data stays similar.
Way 1: Calculate Mean, Standard Deviation, and Standard Error by Hand
Calculating by hand is the best way to understand what the formulas are actually doing. Yes, it takes longer than clicking a spreadsheet button. No, it is not as relaxing as watching a cat video. But it builds real statistical intuition.
Example Data Set
Suppose your data values are:
12, 15, 15, 17, 18, 21
Step 1: Find the Mean
Add the values:
12 + 15 + 15 + 17 + 18 + 21 = 98
Divide by the number of values:
98 / 6 = 16.33
The mean is 16.33.
Step 2: Find Each Deviation from the Mean
Subtract the mean from each data point:
12 - 16.33 = -4.3315 - 16.33 = -1.3315 - 16.33 = -1.3317 - 16.33 = 0.6718 - 16.33 = 1.6721 - 16.33 = 4.67
These deviations show how far each value sits from the average.
Step 3: Square the Deviations
Squaring removes negative signs and gives extra weight to larger distances:
(-4.33)² ≈ 18.78(-1.33)² ≈ 1.78(-1.33)² ≈ 1.78(0.67)² ≈ 0.44(1.67)² ≈ 2.78(4.67)² ≈ 21.78
The sum of squared deviations is approximately 47.33.
Step 4: Divide by n or n – 1
If the data set is a full population, divide by n:
47.33 / 6 = 7.89
If the data set is a sample, divide by n - 1:
47.33 / 5 = 9.47
This gives the variance. The sample version uses n - 1 because a sample tends to underestimate the full population’s variability. That small correction helps make the estimate more reliable.
Step 5: Take the Square Root
For the sample standard deviation:
√9.47 ≈ 3.08
The sample standard deviation is about 3.08.
Step 6: Calculate the Standard Error
Use the standard error formula:
SE = 3.08 / √6
SE ≈ 3.08 / 2.45 = 1.26
The standard error is about 1.26. That means the sample mean of 16.33 has an estimated typical sampling fluctuation of about 1.26 units.
Way 2: Use a Spreadsheet for Faster Calculations
Spreadsheets are the statistical equivalent of a helpful friend who owns a label maker: organized, quick, and weirdly satisfying. Microsoft Excel, Google Sheets, and similar tools can calculate mean, standard deviation, and standard error in seconds.
Spreadsheet Formulas
If your data is in cells A1:A6, you can use:
- Mean:
=AVERAGE(A1:A6) - Sample standard deviation:
=STDEV.S(A1:A6) - Population standard deviation:
=STDEV.P(A1:A6) - Standard error:
=STDEV.S(A1:A6)/SQRT(COUNT(A1:A6))
The most important choice is whether to use STDEV.S or STDEV.P. Use STDEV.S when your data is a sample. Use STDEV.P only when your data represents the entire population you want to describe.
Why Spreadsheets Are Useful
Spreadsheets reduce arithmetic mistakes, especially when your data set has dozens, hundreds, or thousands of values. They also make it easy to update calculations when new values are added. If you run a survey, track weekly sales, monitor test scores, or analyze website conversion rates, spreadsheet formulas are often the fastest practical option.
However, spreadsheets do not magically understand your research question. They will happily calculate a number even if you selected the wrong range, mixed text with numbers, included blank cells, or used population standard deviation when you needed the sample version. The formula is fast; the judgment still belongs to you.
Way 3: Use a Scientific Calculator or Online Statistical Calculator
A scientific calculator is useful when you are in class, taking an exam, or working without a computer. Many calculators have built-in statistics mode. You enter the values, choose one-variable statistics, and the calculator returns the mean and standard deviation.
What to Look For
Most calculators display several symbols. The ones you need are usually:
x̄for the sample meansorSxfor sample standard deviationσorσxfor population standard deviationnfor the number of values
Once you have the sample standard deviation and sample size, calculate standard error with:
SE = s / √n
For example, if your calculator gives s = 3.08 and n = 6, then:
SE = 3.08 / √6 ≈ 1.26
Online Calculator Warning
Online calculators are convenient, but you should still know what they are calculating. Some default to population standard deviation. Others default to sample standard deviation. A few show both but label them in tiny text, which is apparently where important details go to hide.
Before trusting the result, check whether the tool divides by n or n - 1. That choice can change your standard deviation and standard error, especially when the sample size is small.
Way 4: Calculate from a Frequency Table or Grouped Data
Sometimes data does not arrive as a neat list of individual values. Instead, you may receive a frequency table. For example, a teacher may summarize quiz scores like this:
| Score | Frequency |
|---|---|
| 10 | 2 |
| 15 | 4 |
| 20 | 3 |
| 25 | 1 |
Mean from a Frequency Table
Multiply each value by its frequency, add the results, and divide by the total frequency:
(10×2 + 15×4 + 20×3 + 25×1) / (2 + 4 + 3 + 1)
(20 + 60 + 60 + 25) / 10 = 165 / 10 = 16.5
The mean is 16.5.
Standard Deviation from a Frequency Table
To calculate standard deviation, find each value’s distance from the mean, square it, multiply by the frequency, and add those products. Then divide by n - 1 for a sample or by n for a population. Finally, take the square root.
This approach is useful when values repeat many times. Instead of writing 15 four separate times, the frequency table tells you that 15 appears four times. It is cleaner, faster, and less likely to make your notebook look like it lost a fight with a number storm.
Grouped Data Caution
If your data is grouped into intervals, such as 10–14, 15–19, and 20–24, you often use each interval’s midpoint as an estimate. This gives an approximate mean and standard deviation, not exact values. Grouped data is helpful for summaries, but it can hide detail. Whenever possible, use raw data for the most accurate calculations.
Way 5: Use Programming or Statistical Software for Reproducible Work
When your data set becomes large or your analysis needs to be repeated, programming and statistical software are excellent choices. Tools such as R, Python, SPSS, SAS, Stata, and statistical packages in business intelligence platforms can calculate mean, standard deviation, and standard error quickly and consistently.
Why Reproducibility Matters
Reproducibility means someone else can follow your steps and get the same result. This is important in research, business reporting, academic projects, and data journalism. If your sales dashboard says average order value increased, your manager may ask how you calculated it. “The spreadsheet just sort of said so” is not the strongest professional answer.
Programming Logic
The logic is usually the same regardless of software:
- Import or enter the data.
- Remove missing or invalid values if appropriate.
- Calculate the mean.
- Calculate the sample standard deviation.
- Divide the sample standard deviation by the square root of the sample size to get standard error.
In Python-style thinking, the workflow might look like this:
The benefit is not only speed. Code also documents your decisions. You can show how missing values were handled, which rows were included, and whether you used sample or population standard deviation.
Mean vs. Standard Deviation vs. Standard Error: When Should You Use Each?
Use the mean when you want a quick measure of central tendency. It answers, “What is the average value?” This is useful for average test scores, average monthly revenue, average delivery time, average temperature, and average customer rating.
Use the standard deviation when you want to describe variability among individual observations. It answers, “How spread out are the values?” A class with an average score of 85 and a small standard deviation performed consistently. A class with the same average but a large standard deviation had a wider range of results.
Use the standard error when you want to describe the precision of a sample mean. It answers, “How reliable is this sample mean as an estimate of the population mean?” This is especially useful in surveys, experiments, and research reports.
Here is the simplest memory trick: standard deviation describes the data; standard error describes the estimate. If you are talking about how different people, scores, prices, or measurements are from each other, think standard deviation. If you are talking about how confidently your sample mean estimates a bigger group, think standard error.
Common Mistakes to Avoid
Mistake 1: Confusing Standard Deviation and Standard Error
This is the classic statistics mix-up. Standard deviation and standard error are related, but they do different jobs. Standard deviation tells you how much individual values vary. Standard error tells you how much the sample mean may vary from sample to sample.
Mistake 2: Using Population Standard Deviation for Sample Data
If your data is a sample, use the sample standard deviation formula. In spreadsheets, that usually means STDEV.S, not STDEV.P. The difference is especially important for small samples.
Mistake 3: Thinking a Small Standard Error Means the Data Has Little Variation
A data set can have a large standard deviation and a small standard error if the sample size is large. That means individual values are spread out, but the sample mean may still be estimated precisely.
Mistake 4: Ignoring Outliers
Outliers can strongly affect the mean and standard deviation. Before calculating, inspect your data. An outlier might be a real extreme value, or it might be a typo. A recorded age of 220 years deserves a raised eyebrow.
Mistake 5: Reporting Numbers Without Context
A mean without standard deviation can be misleading. A standard deviation without the mean can feel incomplete. A standard error without explaining the sample size may confuse readers. Good statistics are not just calculated; they are communicated clearly.
Practical Example: Comparing Two Study Groups
Imagine two study groups preparing for the same exam. Group A has an average score of 82 with a standard deviation of 3. Group B has an average score of 82 with a standard deviation of 12.
The means are identical, but the stories are different. Group A performed consistently. Most students scored near 82. Group B had much more variation. Some students may have scored very high, while others struggled.
Now suppose Group A had 10 students and Group B had 100 students. The standard error of each group’s mean would depend on both the standard deviation and the sample size. Even if Group B has a larger standard deviation, its larger sample size may reduce the standard error. This is why standard error is so important in research: it connects variability with sample size.
How to Explain These Concepts to a Non-Statistician
If you need to explain these ideas to a client, student, manager, or friend, avoid starting with formulas. Start with meaning.
- Mean: “This is the average result.”
- Standard deviation: “This shows how much individual results vary.”
- Standard error: “This shows how precise our average is as an estimate.”
Then add the formulas only after the reader understands the purpose. Statistics becomes much less intimidating when people know what question each number answers.
Experience Notes: What Working With Mean, Standard Deviation, and Standard Error Teaches You
After calculating mean, standard deviation, and standard error across real projects, one lesson becomes obvious: the mean is useful, but it is rarely enough by itself. In school examples, data is usually tidy. In real life, data behaves more like a toddler with a marker. It has missing values, strange outliers, duplicate entries, inconsistent units, and occasional surprises that make you question your spreadsheet and your life choices.
One practical experience is that the mean can look calm while the data underneath is chaotic. For example, two products may both have an average rating of 4.2 stars. But one product might have mostly 4-star and 5-star reviews, while another has a dramatic mix of 1-star complaints and 5-star love letters. The same mean can hide very different customer experiences. Standard deviation helps reveal that hidden story. A low standard deviation suggests consistency. A high standard deviation tells you people are having very different experiences.
Another useful lesson is that standard error is often misunderstood in reports. Many people see a small standard error and assume the data itself has little variation. That is not always true. Standard error shrinks as sample size grows, so a large sample can produce a precise estimate even when individual values vary widely. This matters in surveys. If 2,000 people answer a question, the average may be estimated more precisely than if only 20 people answer. But that does not mean all 2,000 people agree closely; it only means the estimated average is more stable.
In business analytics, these three measures can prevent overreaction. Imagine a website’s average daily sales rise from $500 to $540. That looks exciting. Cue the confetti cannon, right? Not so fast. If the standard deviation is $200, that increase might be normal daily noise. If the standard error is small and the pattern repeats over time, the increase may be more meaningful. This is where statistics saves teams from celebrating random bumps or panicking over ordinary dips.
In education, standard deviation can help teachers understand whether a class needs broad review or targeted support. If the average test score is low and the standard deviation is small, many students may be struggling with the same concept. If the average is moderate but the standard deviation is large, some students may understand the material well while others need extra help. The mean gives the headline, but the spread gives the teaching strategy.
In research writing, the biggest experience-based tip is to label everything clearly. Say whether you are reporting standard deviation or standard error. Do not write “mean ± 3.2” and leave readers guessing what 3.2 means. That tiny symbol can change the interpretation. A mean plus or minus standard deviation describes variability in the data. A mean plus or minus standard error describes precision of the estimated mean. They are not interchangeable, even if they occasionally wear similar-looking outfits.
Finally, the best habit is to calculate slowly once, then automate. Do one hand calculation to understand the logic. Then use spreadsheets, calculators, or software for larger data sets. This gives you both confidence and efficiency. You know what the computer is doing, but you do not have to manually square 5,000 deviations like a statistics monk living in a cave of graph paper.
Conclusion
Learning how to calculate mean, standard deviation, and standard error gives you a powerful foundation for understanding data. The mean shows the center, the standard deviation shows the spread, and the standard error shows how precise your sample mean is likely to be. Together, they help you move beyond vague impressions and into clear, evidence-based interpretation.
The five methods covered herehand calculation, spreadsheets, calculators, frequency tables, and programming workflowseach have their place. Hand calculation builds understanding. Spreadsheets save time. Calculators are convenient. Frequency tables handle summarized data. Programming supports larger, repeatable analysis. The smartest method depends on your data size, purpose, tools, and need for accuracy.
Most importantly, do not treat statistics as a pile of formulas to memorize. Treat each measure as an answer to a question. What is typical? Use the mean. How much do values vary? Use standard deviation. How precise is the sample average? Use standard error. Once you see the purpose behind the math, the formulas become far less mysteriousand much more useful.