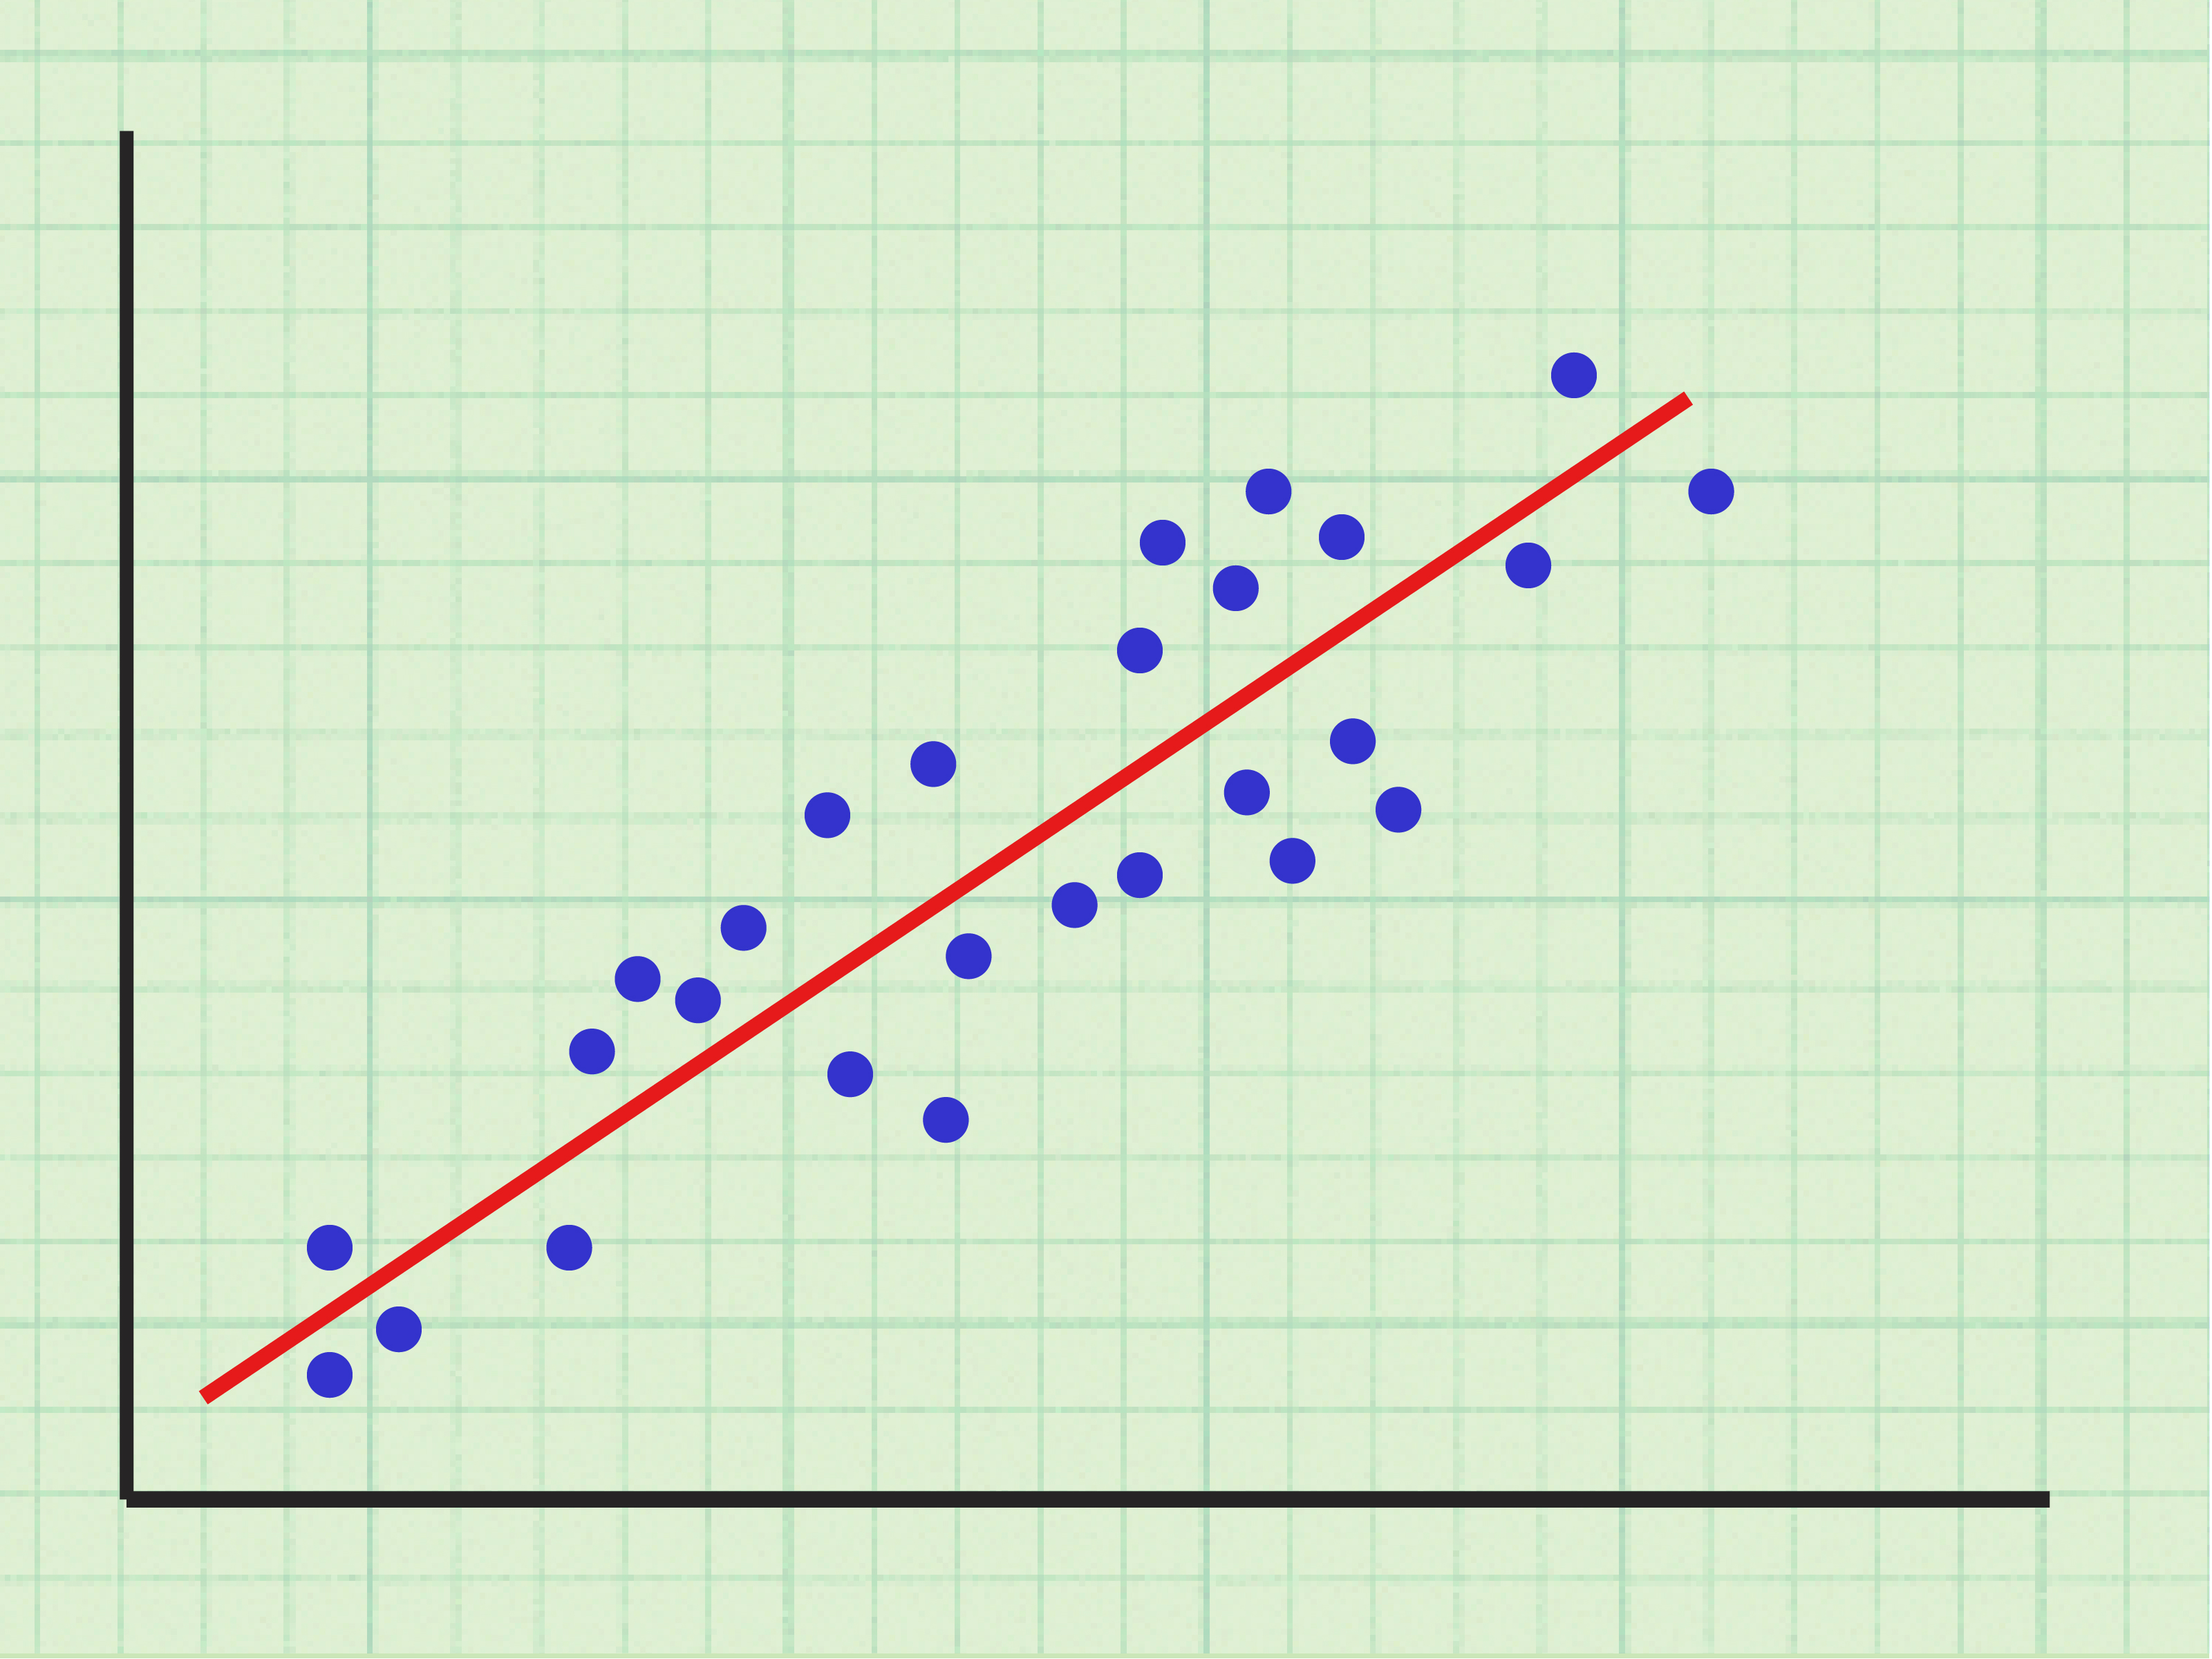
Stock correlation sounds like something whispered by analysts in expensive vests, but the idea is refreshingly simple: it tells you how closely two stocks move together. If Apple and Microsoft tend to rise and fall on the same days, they may have a positive correlation. If one usually climbs while the other sulks in the corner, they may have a negative correlation. If their movements seem unrelated, congratulationsyou have discovered the financial version of two people dancing to different songs.
Learning how to calculate stock correlation coefficient is useful for investors, finance students, traders, portfolio builders, and anyone who has ever wondered whether owning five technology stocks is really “diversification” or just one giant hoodie with five logos on it. The stock correlation coefficient, usually the Pearson correlation coefficient, ranges from -1 to +1. A result close to +1 means two stocks move strongly in the same direction. A result close to -1 means they move strongly in opposite directions. A result near 0 means there is little linear relationship between their returns.
This guide explains the calculation in 12 clear steps, using stock returns, spreadsheets, and practical interpretation. It is educational, not personal financial advice, but it will help you read your portfolio with sharper eyes and fewer spreadsheet-induced sighs.
What Is a Stock Correlation Coefficient?
A stock correlation coefficient measures the strength and direction of the relationship between two stocks’ returns over a chosen period. In plain English, it answers the question: “When Stock A moves, does Stock B usually move with it, against it, or wander off to buy snacks?”
The most common version is the Pearson correlation coefficient. It focuses on linear relationships, which means it looks for a consistent straight-line pattern between two return series. It does not prove that one stock causes the other to move. It simply measures whether their historical returns have moved together.
Correlation values at a glance
- +1.00: Perfect positive correlation. The two stocks moved together exactly in the same direction.
- +0.70: Strong positive correlation. They often moved together, though not perfectly.
- +0.30: Weak positive correlation. There is some relationship, but it is not especially strong.
- 0.00: No clear linear correlation.
- -0.30: Weak negative correlation.
- -0.70: Strong negative correlation. One often moved up while the other moved down.
- -1.00: Perfect negative correlation. One moved exactly opposite the other.
Why Stock Correlation Matters
Correlation is a practical risk-management tool. Investors often diversify to avoid putting all their money into assets that behave the same way. If every holding in a portfolio reacts similarly to inflation, interest rates, earnings shocks, or market panic, the portfolio may look diversified on paper but act like a synchronized swimming team during a storm.
Low or negative correlation can help smooth portfolio volatility because different assets may respond differently to the same market environment. That does not mean correlation eliminates risk. It does not. Correlations can change, especially during market stress, when many assets suddenly decide to hold hands and run downhill together. Still, calculating correlation gives you a clearer view of hidden concentration risk.
The Formula for Stock Correlation Coefficient
The Pearson correlation formula for two return series is:
r = Σ[(x – x̄)(y – ȳ)] / √{Σ(x – x̄)2 × Σ(y – ȳ)2}
Where:
- r is the stock correlation coefficient.
- x is each return for Stock A.
- y is each return for Stock B.
- x̄ is the average return of Stock A.
- ȳ is the average return of Stock B.
- Σ means “sum everything.”
The formula looks intimidating, but it is mostly subtraction, multiplication, squaring, and adding. In other words, it is not a dragon. It is a lizard wearing a cape.
How to Calculate Stock Correlation Coefficient: 12 Steps
Step 1: Choose the two stocks you want to compare
Start by selecting two stocks, exchange-traded funds, or other securities. For example, you might compare two technology companies, a bank stock and an energy stock, or an individual stock and the S&P 500 ETF. Your choice should match the question you want to answer. If you want to know whether two holdings are too similar, compare those two holdings. If you want to know whether a stock behaves like the broader market, compare it with a market index fund.
Step 2: Pick a time period
Correlation depends heavily on the period you choose. A one-month correlation may look very different from a five-year correlation. Short windows can be noisy, while long windows may hide recent changes. Many investors use one year, three years, or five years of data, depending on the purpose. For tactical analysis, daily returns over six to twelve months may be useful. For long-term portfolio construction, monthly returns over several years can provide a calmer picture.
Step 3: Collect historical price data
Gather historical prices for both stocks over the same dates. Use adjusted closing prices when possible, because adjusted prices account for dividends, stock splits, and other corporate actions. This matters because raw closing prices can distort returns. If one stock had a split and the other did not, your calculation could become a mathematical smoothie with suspicious chunks.
Step 4: Align the dates
Both stocks must have returns for the same trading dates. If Stock A has a price for Monday but Stock B does not, remove or adjust the unmatched date. Correlation requires paired observations. Each return for Stock A must line up with the matching return for Stock B. This is especially important when comparing securities from different countries, funds with different trading calendars, or newly listed stocks.
Step 5: Convert prices into returns
Do not calculate correlation using price levels unless you have a special reason. For stocks, correlation is usually calculated from returns, not prices. A simple daily return formula is:
Return = (Today’s Adjusted Close / Yesterday’s Adjusted Close) – 1
For example, if a stock’s adjusted close moves from $100 to $102, the daily return is:
($102 / $100) – 1 = 0.02, or 2%
Using returns makes the comparison fairer because it measures percentage movement rather than dollar price. A $5 move in a $50 stock is very different from a $5 move in a $500 stock.
Step 6: Calculate the average return for each stock
Next, calculate the average return for Stock A and Stock B over the chosen period. This gives you the baseline for each stock. The correlation formula measures how each day’s return differs from that stock’s own average, then checks whether those differences tend to happen together.
Step 7: Find each return’s deviation from its average
For every observation, subtract the average return from that day’s return. Do this separately for both stocks. If Stock A returned 1.2% and its average return was 0.4%, the deviation is 0.8%. If Stock B returned 0.3% and its average return was 0.2%, the deviation is 0.1%.
These deviations are the heart of correlation. They show whether each stock was above or below its usual performance on the same date.
Step 8: Multiply paired deviations
For each date, multiply Stock A’s deviation by Stock B’s deviation. If both deviations are positive, the product is positive. If both are negative, the product is also positive. If one is positive and the other is negative, the product is negative. This is how the formula detects whether two stocks tend to move in the same direction or opposite directions.
Step 9: Square each deviation
Square Stock A’s deviations and Stock B’s deviations separately. Squaring removes negative signs and gives more weight to larger movements. This part of the calculation helps standardize the relationship so the final answer fits neatly between -1 and +1.
Step 10: Sum the results
Add up the multiplied paired deviations. Then add up the squared deviations for Stock A and Stock B. At this point, you have the numerator and denominator ingredients for the formula. The numerator tells you whether the stocks generally moved together or apart. The denominator scales that relationship by each stock’s volatility.
Step 11: Divide to get the correlation coefficient
Now divide the sum of paired deviations by the square root of the two squared-deviation sums multiplied together. The result is the stock correlation coefficient. If the answer is 0.72, the stocks had a strong positive historical correlation during your chosen period. If the answer is -0.45, they had a moderate negative correlation. If the answer is 0.05, the relationship was weak or nearly nonexistent.
Step 12: Interpret the result in context
The number is useful, but it is not magic. A high correlation between two technology stocks may be expected. A high correlation between a utility stock and a growth stock may deserve closer investigation. A low correlation may help diversification, but only if the assets also fit your goals, risk tolerance, time horizon, and investment plan.
Also remember that correlation is historical. It describes what happened, not what must happen next. Markets are dramatic. They change costumes without warning.
A Simple Stock Correlation Example
Imagine you calculate eight daily returns for Stock A and Stock B:
| Day | Stock A Return | Stock B Return |
|---|---|---|
| 1 | 1.2% | 0.3% |
| 2 | -0.5% | 0.1% |
| 3 | 0.8% | 1.0% |
| 4 | 2.1% | 1.2% |
| 5 | -1.0% | -0.4% |
| 6 | 0.4% | -0.6% |
| 7 | -0.2% | 0.5% |
| 8 | 1.5% | 0.9% |
Using the Pearson formula, the correlation is approximately 0.71. That suggests a strong positive relationship during this small sample. The stocks did not move together perfectly, but they often leaned in the same direction. In portfolio terms, owning both may provide less diversification than owning two stocks with a lower correlation.
How to Calculate Stock Correlation in Excel
Excel makes the calculation much faster. Put Stock A returns in one column and Stock B returns in another column. If Stock A returns are in cells B2 through B253 and Stock B returns are in C2 through C253, use:
=CORREL(B2:B253,C2:C253)
Excel will return the correlation coefficient instantly. You can also use the PEARSON function, which returns the Pearson product-moment correlation coefficient. For most stock correlation tasks, CORREL is simple and effective.
How to Calculate Stock Correlation in Google Sheets
Google Sheets works similarly. If your two return series are in columns B and C, use:
=CORREL(B2:B253,C2:C253)
This is one of the easiest ways to calculate stock correlation coefficient without building the formula manually. The important part is preparing clean return data first. A spreadsheet formula cannot rescue messy inputs. It will simply calculate messy outputs faster, like a tiny robot with no judgment.
How to Calculate Stock Correlation in Python
Python is useful when you want to analyze many stocks or build a full correlation matrix. With pandas, the basic idea is:
For a portfolio with many stocks, use:
A correlation matrix shows every stock’s relationship with every other stock. This is helpful for identifying clusters. For example, several semiconductor stocks may all show high correlations with each other, while a consumer staples stock may behave differently.
Common Mistakes When Calculating Stock Correlation
Using prices instead of returns
Stock prices often trend upward over long periods, which can create misleading correlations. Returns are usually the better input because they measure actual percentage changes.
Using mismatched dates
If dates do not line up, your calculation becomes unreliable. Always match observations by date before calculating correlation.
Ignoring dividends and splits
Adjusted close data helps account for dividends and stock splits. Ignoring these adjustments can distort returns.
Trusting one time window too much
A 30-day correlation can be useful, but it may be noisy. A five-year correlation can be useful, but it may miss recent changes. Compare multiple windows when possible.
Assuming correlation means causation
If two stocks move together, that does not mean one caused the other to move. They may both be reacting to interest rates, earnings expectations, oil prices, investor sentiment, or a market-wide sell-off.
How Investors Use Stock Correlation
Investors use stock correlation to evaluate diversification, manage risk, compare sectors, and understand portfolio behavior. A portfolio filled with highly correlated stocks may rise quickly in a friendly market, but it may also fall together when conditions turn ugly. A portfolio with lower correlations may experience smoother performance, although it can still lose money.
For example, suppose an investor owns five large-cap technology stocks. The account may appear diversified because there are five tickers. But if all five stocks are highly correlated, the portfolio may be heavily exposed to the same growth-stock, interest-rate, and earnings-cycle risks. Adding assets with lower correlation may reduce overall volatility, depending on the investor’s goals.
Correlation can also help investors compare a stock with a benchmark. A stock with a very high correlation to the S&P 500 may behave much like the broader market. A stock with a low correlation may offer different behavior, for better or worse.
What Is a Good Stock Correlation Coefficient?
There is no universal “good” correlation. It depends on your objective. If you are building a concentrated strategy around a specific sector, high correlation may be expected. If you are trying to diversify, lower correlation may be more attractive. If you are hedging, negative correlation may be useful, although true negative stock-to-stock correlations are less common than many beginners expect.
As a general guide:
- 0.80 to 1.00: Very high positive correlation.
- 0.60 to 0.79: High positive correlation.
- 0.30 to 0.59: Moderate positive correlation.
- -0.29 to 0.29: Weak or low linear correlation.
- -0.30 to -0.59: Moderate negative correlation.
- -0.60 to -1.00: High negative correlation.
Use these ranges as a rough map, not a law carved into Wall Street marble. Correlation should be paired with volatility, expected return, valuation, sector exposure, fundamentals, and personal risk tolerance.
Stock Correlation vs. Covariance
Covariance and correlation are related, but they are not the same. Covariance shows whether two assets tend to move in the same direction or opposite directions. However, covariance is not standardized, so its size can be hard to interpret. Correlation standardizes covariance by dividing it by the assets’ standard deviations. That is why correlation always falls between -1 and +1.
In practical terms, covariance says, “These two things move together.” Correlation says, “Here is how strongly they move together on a clean, comparable scale.” Correlation is usually easier for investors to interpret.
Real-World Experience: Lessons From Calculating Stock Correlation
One of the first lessons investors learn from calculating stock correlation is that ticker count is not the same as diversification. A portfolio can hold ten different stocks and still act like one giant stock if they share the same sector, business drivers, customer base, or sensitivity to interest rates. This becomes obvious when you build a correlation matrix. Suddenly, the portfolio stops looking like a well-balanced dinner plate and starts looking like twelve versions of mashed potatoes.
In practice, the most useful experience is comparing correlations across different time frames. A pair of stocks may show a correlation of 0.45 over five years, 0.72 over one year, and 0.88 over the last three months. That does not mean the math is broken. It means the relationship changed. During periods of market stress, correlations often rise because investors sell many risky assets at the same time. During calmer markets, company-specific factors may matter more, and correlations can drift lower.
Another helpful habit is checking whether a correlation result makes economic sense. If two regional bank stocks show high correlation, that is not surprising. They may both react to interest rates, credit conditions, deposit trends, and banking regulations. If a grocery chain and a cloud software company show unusually high correlation, you may want to inspect the time period. Maybe a broad market shock dominated both stocks. Maybe the sample was too short. Maybe your data has errors. Correlation is a clue, not a courtroom confession.
Investors also discover that negative correlation is harder to find than finance textbooks sometimes make it sound. Many stocks have positive correlations with the overall equity market because they are all businesses affected by growth expectations, liquidity, and investor appetite for risk. To find lower correlations, investors often look beyond individual stocks into bonds, commodities, real estate, international assets, cash equivalents, or alternative strategies. Even then, relationships can change.
For beginners, the best experience is to calculate correlation manually once, then use spreadsheets or Python afterward. Doing it by hand teaches what the number means. Using software keeps you sane. Manual calculation reveals that correlation is built from deviations around average returns, not mystical market energy. After that, Excel, Google Sheets, or Python can handle the repetitive work.
The biggest practical lesson is humility. A correlation coefficient can make a portfolio easier to understand, but it cannot predict the future with certainty. It should be part of a broader investment process that includes diversification, position sizing, asset allocation, risk management, and common sense. Common sense is not available as a spreadsheet function, unfortunately. Investors must install that one themselves.
Conclusion
Knowing how to calculate stock correlation coefficient gives you a better way to understand how investments behave together. The process begins with clean historical prices, continues with return calculations, and ends with the Pearson correlation coefficient. Whether you calculate it manually, in Excel, in Google Sheets, or with Python, the goal is the same: measure the historical relationship between two return series.
A high positive correlation means two stocks often moved together. A negative correlation means they often moved in opposite directions. A near-zero correlation means there was little linear relationship. None of these results guarantees future performance, but each can improve your understanding of portfolio risk. In a market full of noise, correlation is one of those tools that quietly says, “Maybe check whether your investments are all wearing the same jersey.”