Real estate listings love to advertise cap rates as if they were nutritional labels: “Now with 7% cap rate!” Unfortunately, a cap rate is only as trustworthy as the income and expense numbers hiding behind it. A seller can make almost any property look impressive by assuming perfect occupancy, unusually low repairs, and an insurance bill apparently negotiated by a wizard.
Learning how to figure cap rate gives you a fast way to compare income-producing properties without allowing mortgage terms, down payments, or personal tax situations to muddy the picture. The calculation measures the relationship between a property’s annual net operating income and its value. In plain English, it estimates how much operating income the property produces relative to what it costs.
The basic cap rate formula is:
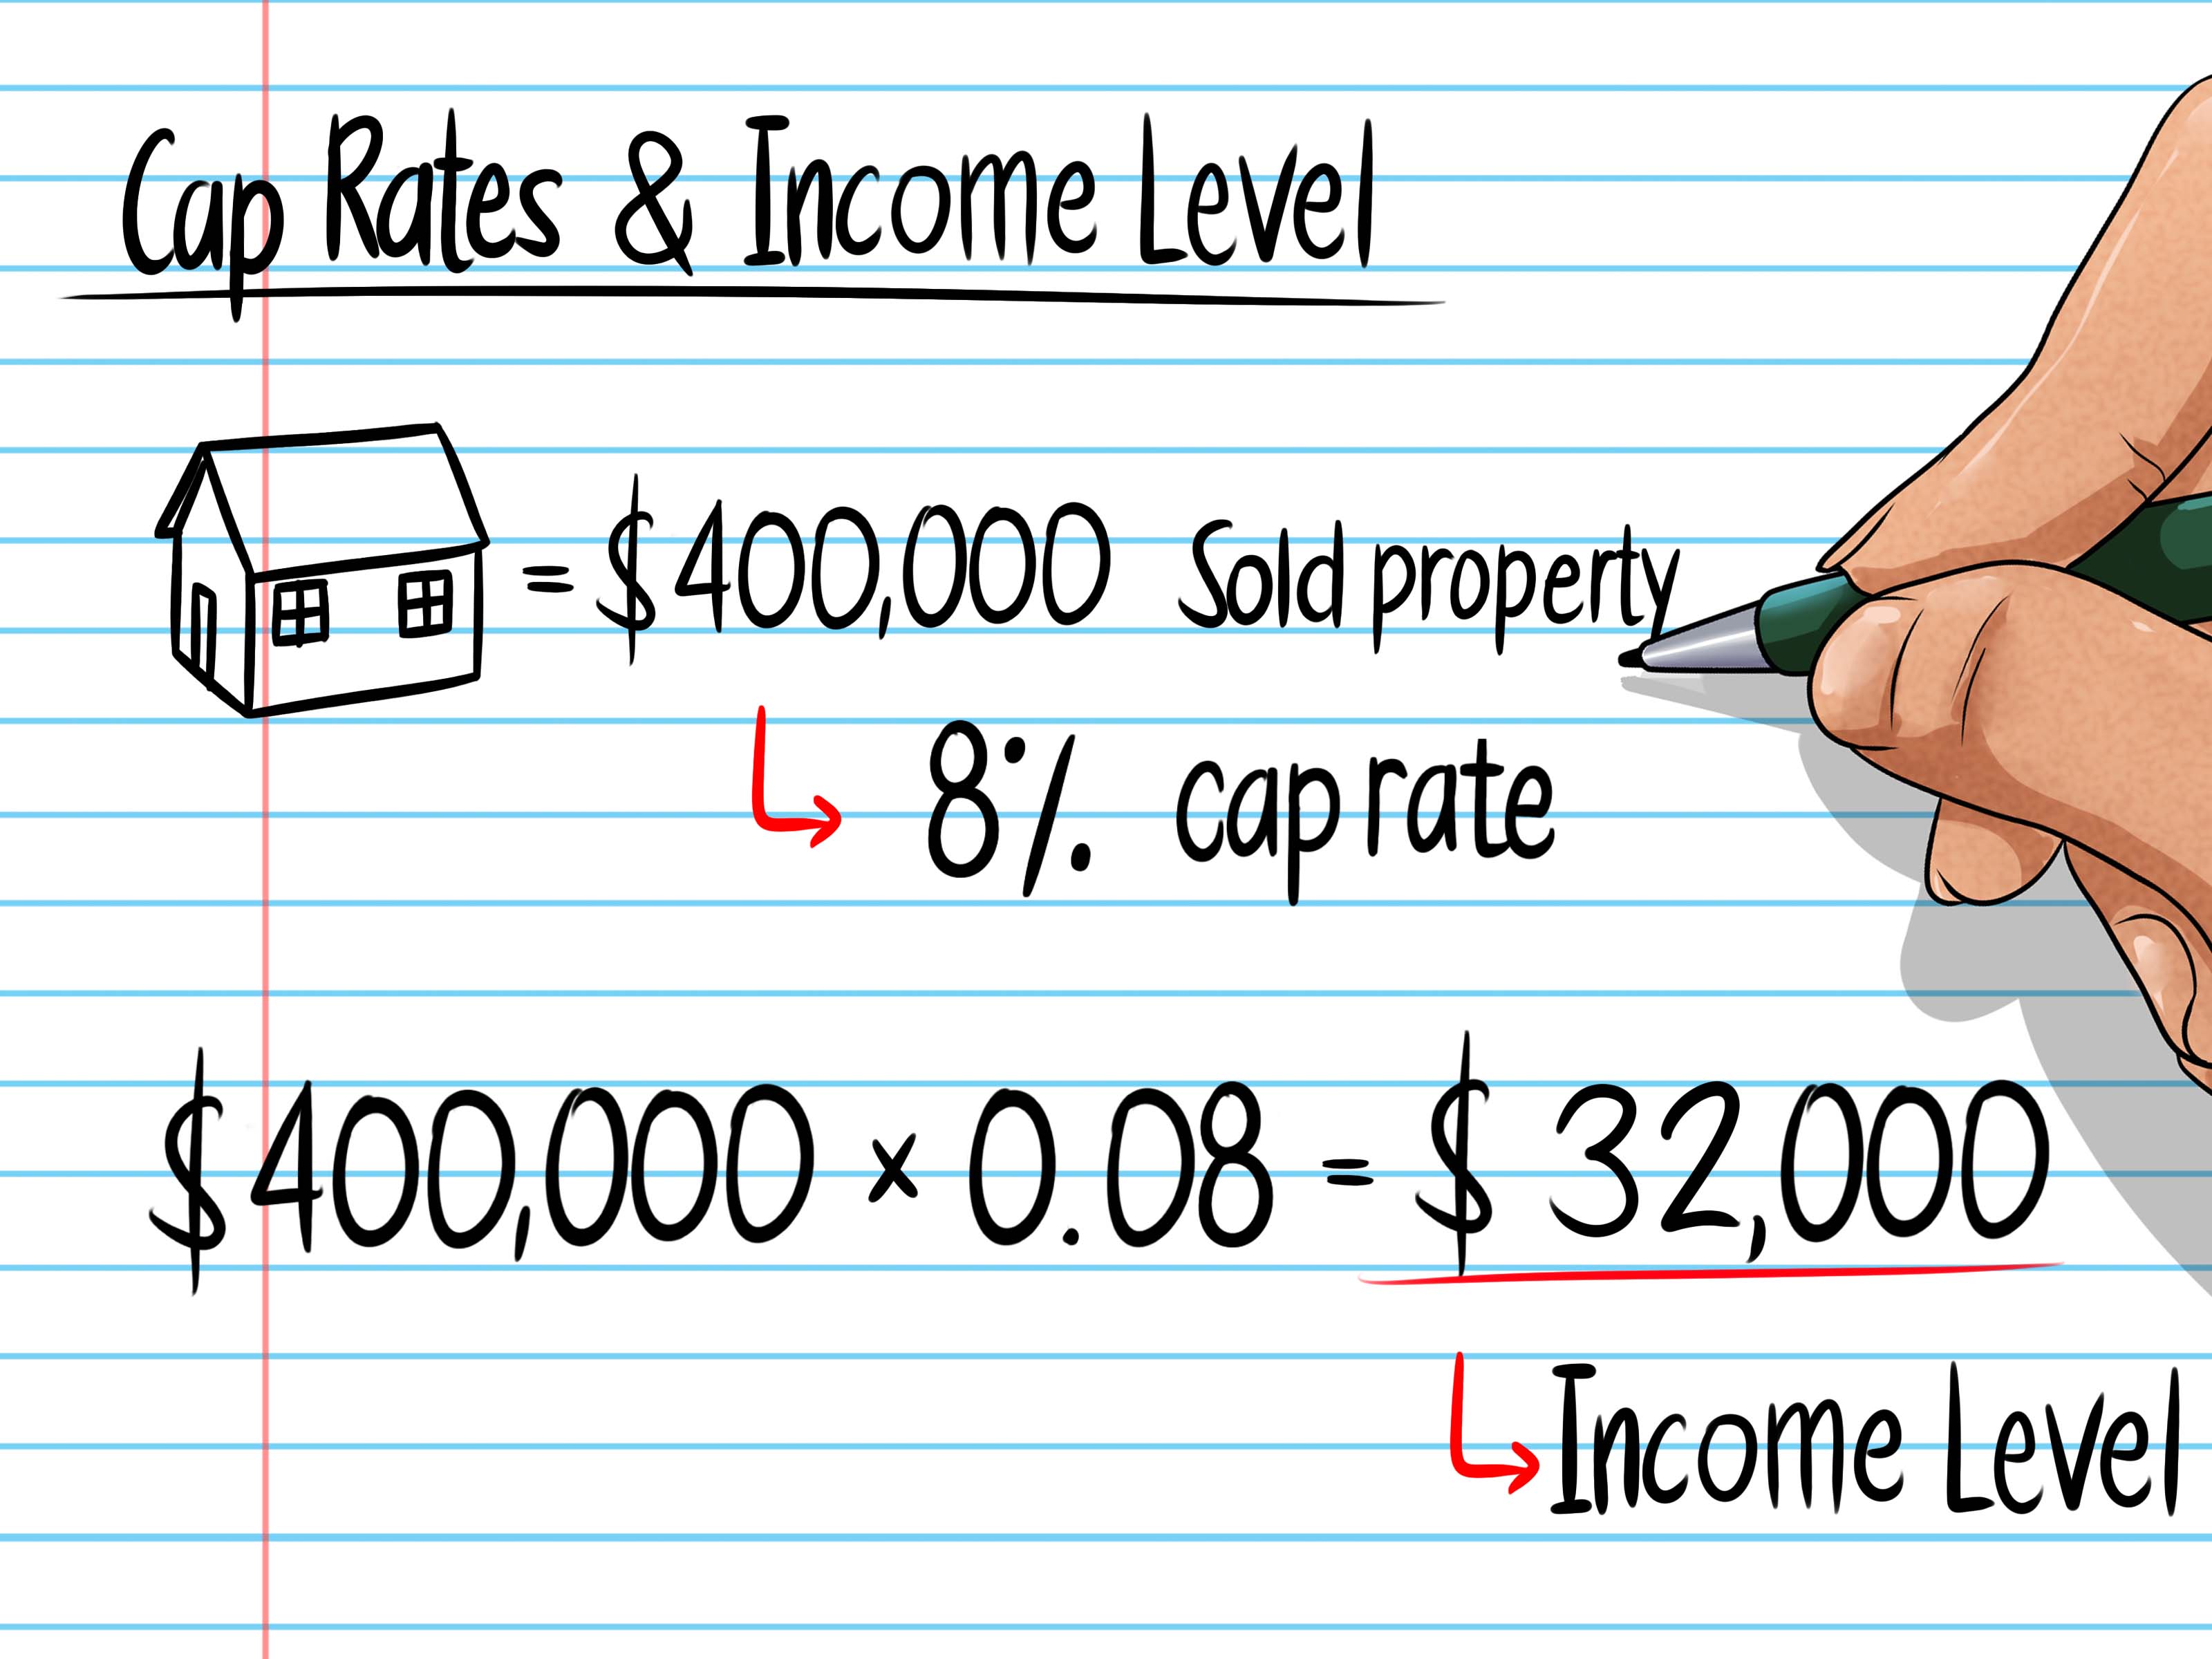
Capitalization Rate = Net Operating Income ÷ Property Value × 100
For example, a property producing $40,000 in annual net operating income and valued at $500,000 has an 8% cap rate. The formula is simple. Building a realistic net operating income figure is where the actual work begins. U.S. appraisal and lending guidance commonly defines net operating income as effective gross income minus operating expenses, while direct capitalization relates that income to a property’s value.
What Does Cap Rate Tell You?
A cap rate is best viewed as a one-year, unleveraged income yield. “Unleveraged” means the calculation ignores financing. Two investors may use different down payments and receive wildly different mortgage rates, but the property itself still has the same income-producing ability.
Cap rate can help you:
- Compare similar rental properties in the same market
- Estimate a property’s value from its income
- Identify unusually optimistic listing assumptions
- Measure changes in operating performance over time
- Screen deals before performing a deeper financial analysis
It does not measure appreciation, tax benefits, loan costs, future renovation gains, or your complete return on investment. Think of it as a useful flashlight, not the entire home inspection.
Step 1: Choose the Correct Property Value
The denominator in the cap rate formula is normally the property’s purchase price or current market value.
For a property you are considering buying
Use the price you realistically expect to pay. If the seller is asking $500,000 but your likely acquisition price is $470,000, calculate the cap rate using $470,000 when evaluating your offer.
For a property you already own
Use its current market value rather than the price you paid years ago. Your original cost can show the return on your historical purchase, but it does not describe the property’s current income yield.
Suppose you bought a duplex for $250,000 and it is now worth $400,000. If its annual NOI is $24,000, the current cap rate is 6%:
$24,000 ÷ $400,000 = 0.06, or 6%
Dividing the same NOI by the old purchase price would produce 9.6%. That may feel more flattering, but it answers a different question.
For a conventional calculation, do not automatically add your down payment, mortgage balance, or financing charges to the denominator. A value-add project may justify a separate “yield on cost” calculation using the purchase price plus renovation costs, but that metric should be labeled clearly so it is not confused with a standard going-in cap rate. Industry sources consistently describe the basic formula as NOI divided by purchase price or current market value.
Step 2: Calculate Gross Potential Income
Gross potential income is the revenue the property could generate if its rentable space were fully occupied and tenants paid everything they owed.
Start by annualizing the monthly rent:
Monthly Rent × 12 = Annual Potential Rent
If four apartments each rent for $1,250 per month, the gross potential rent is:
4 × $1,250 × 12 = $60,000
Add recurring property-related income such as:
- Parking fees
- Laundry revenue
- Storage rent
- Pet rent
- Utility reimbursements
- Vending or equipment income
Do not casually count refundable security deposits as revenue. Also avoid relying on rent that the property might someday earn after a beautiful renovation, a perfect leasing campaign, and the arrival of tenants willing to pay anything for brushed-brass cabinet handles.
When underwriting an occupied property, review the rent roll, current leases, payment history, and trailing operating statements. Compare existing rents with credible market rents, but keep actual income and projected income in separate scenarios. Fannie Mae’s multifamily guidance, for example, distinguishes property income supported by current rents, market rents, rent rolls, and actual collections.
Step 3: Subtract Vacancy and Credit Loss
A building that could collect $60,000 under perfect conditions rarely collects every dollar. Units become vacant, tenants move out unexpectedly, checks arrive late, and occasionally someone disappears while leaving behind a sofa that appears to weigh as much as a compact car.
Vacancy and credit loss account for revenue you are unlikely to collect. The adjustment should reflect the property’s history and the local market rather than an arbitrary nationwide rule.
The formula is:
Gross Potential Rent × Vacancy Rate = Vacancy Allowance
If potential rent is $60,000 and the reasonable vacancy and credit-loss assumption is 5%, the allowance is:
$60,000 × 5% = $3,000
Subtract that amount from gross potential income. If the property also earns $1,200 from laundry machines, its effective gross income would be:
$60,000 + $1,200 − $3,000 = $58,200
Economic vacancy can be broader than physically empty units. It may also include unpaid rent, concessions, model units, employee units, or space leased below market. Vacancy directly reduces effective income and, consequently, NOI.
How to choose a vacancy assumption
Review at least three sources:
- The property’s occupancy and collection history
- Comparable properties in the neighborhood
- Recent local market reports for the same property type
A property that is currently full may still need a vacancy allowance. One photograph of a “For Rent” sign is enough to remind investors that 100% occupancy is a condition, not a law of physics.
Step 4: Add Up Normal Operating Expenses
Operating expenses are recurring costs required to keep the property functioning and producing rent. Common expenses include:
- Property taxes
- Landlord insurance
- Property management
- Repairs and routine maintenance
- Owner-paid utilities
- Landscaping and snow removal
- Pest control
- Cleaning and turnover costs
- Licensing, permits, and inspection fees
- Homeowners association fees
- Legal, bookkeeping, and administrative costs
Fannie Mae’s underwriting framework similarly subtracts expenses such as taxes, insurance, utilities, repairs, maintenance, payroll, marketing, professional fees, and general administrative costs when determining NOI.
Expenses that do not belong in NOI
Do not subtract the following when calculating a standard cap rate:
- Mortgage principal
- Mortgage interest
- Personal income taxes
- Accounting depreciation
- Owner-specific acquisition financing costs
Mortgage payments are excluded because cap rate evaluates the real estate independently of an investor’s financing choices. Depreciation is excluded because it is a noncash tax deduction rather than a current property-operating bill. Rental income and deductible expenses may later be reported for tax purposes, commonly through Schedule E, but taxable income is not the same measurement as property NOI.
What about major capital expenditures?
A new roof, full HVAC replacement, structural repair, or complete kitchen renovation is generally treated differently from routine maintenance. These costs are not normally deducted as ordinary operating expenses in the basic NOI calculation.
However, ignoring future replacements would make the investment analysis dangerously cheerful. Track capital expenditures in a separate schedule and consider a replacement reserve when stress-testing cash flow. Some institutional underwriting methods calculate NOI first and then subtract replacement reserves when determining net cash flow. Consistency is essential when comparing your property with market cap rates.
Step 5: Calculate Net Operating Income
Once you have effective gross income and operating expenses, calculate NOI:
Net Operating Income = Effective Gross Income − Operating Expenses
Suppose a rental property has:
- $48,000 in annual potential rent
- $1,200 in other recurring income
- $2,400 in vacancy and credit loss
- $18,800 in annual operating expenses
First, calculate effective gross income:
$48,000 + $1,200 − $2,400 = $46,800
Then calculate NOI:
$46,800 − $18,800 = $28,000
The property’s annual NOI is $28,000. This is the number that goes on top of the cap rate formula.
Use annual figures throughout the calculation. Mixing monthly rent with annual taxes is a quick way to discover a miraculous 73% cap rate that exists only because the spreadsheet has lost contact with reality.
Step 6: Divide NOI by Property Value
Assume the property in the example is available for $425,000 and produces $28,000 in annual NOI.
$28,000 ÷ $425,000 = 0.06588
Multiply by 100:
0.06588 × 100 = 6.59%
The property’s estimated cap rate is 6.59%.
| Item | Annual Amount |
|---|---|
| Potential rental income | $48,000 |
| Other property income | $1,200 |
| Vacancy and credit loss | −$2,400 |
| Effective gross income | $46,800 |
| Operating expenses | −$18,800 |
| Net operating income | $28,000 |
| Property price | $425,000 |
| Cap rate | 6.59% |
How to Interpret the Result
A higher cap rate generally indicates more current income per dollar of property value. It can also signal greater perceived risk, weaker expected growth, an inferior location, physical problems, uncertain tenants, or a property that requires more active management.
A lower cap rate may reflect a prime location, newer construction, stronger tenants, predictable income, limited competition, or expectations of future rent growth. Therefore, “higher” does not automatically mean “better.” An 11% cap rate attached to a building with failing plumbing and half the units vacant may be less of a bargain and more of a cry for help.
There is no universal good cap rate. Compare the result with recent sales involving similar properties in the same submarket, condition, occupancy range, and risk category. National firms publish cap-rate research by property type and location because rates vary materially across markets and asset classes.
How to Use Cap Rate to Estimate Property Value
You can rearrange the formula to estimate value:
Estimated Property Value = NOI ÷ Market Cap Rate
Suppose a small apartment building produces $75,000 in stabilized NOI and comparable buildings trade at approximately a 6% cap rate:
$75,000 ÷ 0.06 = $1,250,000
At a 7% cap rate, the same income supports a lower estimated value:
$75,000 ÷ 0.07 = $1,071,429
This illustrates the inverse relationship between value and cap rate. When NOI remains unchanged, a lower cap rate produces a higher indicated value, while a higher cap rate produces a lower value. The income approach is widely used when valuing income-producing real estate, although a professional appraisal may also incorporate comparable sales, replacement costs, lease details, and discounted cash-flow analysis.
Common Cap Rate Mistakes
Using gross rent instead of NOI
Gross rent ignores vacancy and the costs of operating the property. Dividing gross rent by price produces a gross rent yield, not a cap rate.
Subtracting the mortgage payment
Debt belongs in cash-flow, debt-service-coverage, and cash-on-cash calculations. It does not belong in standard NOI.
Trusting the seller’s expense statement
Confirm taxes, insurance, utilities, repairs, management, and maintenance independently. A marketing package is designed to sell the property, not to protect your retirement account.
Ignoring property management
Include a reasonable management expense even when you plan to manage the property yourself. Your time has value, and a future buyer may not share your enthusiasm for answering plumbing calls at 1:17 a.m.
Using current taxes after a taxable sale
Property taxes may change after reassessment or transfer. Review local rules and estimate taxes based on the likely post-purchase assessment rather than blindly carrying forward the seller’s old bill. Freddie Mac appraisal guidance specifically requires analysis of anticipated tax changes that may affect NOI and property value.
Comparing unrelated assets
Comparing the cap rate of a suburban duplex with that of a downtown office tower is not particularly useful. Compare similar property types, locations, lease structures, conditions, and tenant profiles.
Cap Rate Versus Other Real Estate Metrics
Cap rate should be used alongside other measurements:
- Cash-on-cash return: Annual pre-tax cash flow divided by the cash you invested
- Debt service coverage ratio: NOI divided by annual debt payments
- Gross rent multiplier: Property price divided by gross rental income
- Internal rate of return: A multiyear return estimate that considers the timing of cash flows
- Equity multiple: Total cash received divided by total cash invested
A property can have a respectable cap rate and poor cash flow if the financing is expensive. It can also have a modest initial cap rate and a compelling long-term return if rents are below market and the improvement plan is realistic. No single metric gets to wear the superhero cape.
Conclusion
To figure cap rate, determine the property value, calculate potential income, subtract vacancy, total the operating expenses, calculate NOI, and divide NOI by value. The final percentage gives you a standardized snapshot of the property’s current income production before financing.
The formula is easy enough to fit on a napkin. Accurate inputs require leases, tax records, insurance quotes, utility bills, maintenance histories, market research, and a healthy suspicion of unusually perfect projections. Use cap rate to screen and compare deals, then evaluate financing, capital repairs, taxes, appreciation potential, and downside risk before investing.
Practical Experience: What Real Cap Rate Analysis Teaches You
The first lesson is that historical numbers beat decorative projections. A seller’s pro forma may show what the property could earn after every unit is renovated, every tenant accepts a rent increase, and every operating expense politely remains unchanged. Begin with the trailing 12 months of actual collections and bills. Then build a separate stabilized scenario. Keeping the two versions apart prevents future improvements from sneaking into today’s value.
The second lesson is to call the insurance agent early. Old estimates and the seller’s policy may be useless to a new buyer. Premiums can differ based on roof age, wiring, plumbing, loss history, location, building use, deductibles, and coverage limits. A surprise insurance increase can remove thousands of dollars from NOI. At a 6% market cap rate, every $1,000 reduction in sustainable NOI can reduce indicated value by roughly $16,667. Small expense errors can become large valuation errors.
The third lesson is that taxes deserve their own investigation. The current owner may benefit from an old assessment, exemption, appeal, or capped annual increase. After the sale, the property could be reassessed closer to the purchase price. Investors who copy the seller’s tax bill without checking local rules sometimes discover that their “excellent” cap rate lasted only until the next tax notice arrived.
The fourth lesson is to normalize maintenance. One quiet year does not prove that a building is maintenance-free. The owner may have postponed work, performed repairs personally, or classified expenses inconsistently. Review several years when possible. Inspect roofs, HVAC systems, pavement, plumbing, electrical panels, windows, appliances, and drainage. A low repair figure may describe a well-maintained propertyor a maintenance department whose strategy was to stop opening the mail.
The fifth lesson is to price management realistically. Owner-operators sometimes exclude management because they intend to do the work themselves. That exaggerates the property’s operating performance and makes comparisons inconsistent. Include a market-based management cost, then treat any savings from self-management as compensation for your labor rather than magical property income.
The sixth lesson is to stress-test the calculation. Do not stop after producing one cap rate. Create a base case, conservative case, and improved case. Test lower rent, higher vacancy, larger insurance premiums, increased taxes, and ordinary maintenance inflation. A deal that works only when every assumption lands perfectly is not an investment model; it is a motivational poster.
The final lesson is that context matters more than a target percentage. A lower-cap property with strong tenants, modern systems, and limited nearby supply may be more attractive than a higher-cap property with deferred maintenance and unstable collections. Cap rate helps organize the conversation, but leases, location, physical condition, financing, and long-term demand determine whether the ending is profitable.
Research note: The guidance above synthesizes U.S. tax information, multifamily underwriting standards, bank-regulatory valuation guidance, commercial market research, and established real-estate education sources, including the IRS, Fannie Mae, Freddie Mac, FDIC, CBRE, Colliers, Investopedia, BiggerPockets, Corporate Finance Institute, The Motley Fool, and Rocket Mortgage.