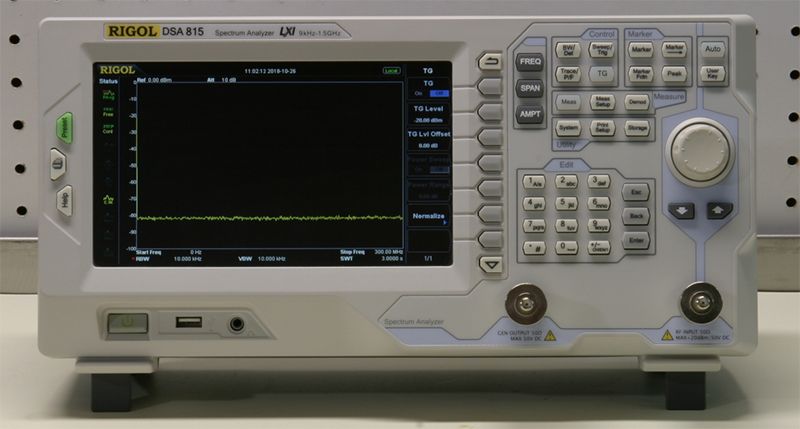
A cheap spectrum analyzer is like a pocket flashlight in a dark warehouse: it will not turn you into a professional RF lab overnight, but it can keep you from tripping over obvious problems. Whether you bought a tiny handheld analyzer, an RF Explorer-style device, or an SDR dongle pretending very hard to be laboratory equipment, the trick is learning what it can do, what it cannot do, and when it is politely lying to your face.
The good news is that low-cost RF test gear has become surprisingly useful. You can hunt for interference, check whether a transmitter is alive, compare antennas, look for harmonics, inspect filters, and learn the language of the frequency domain without selling your desk, your chair, and possibly your left sneaker. The bad news is that cheap spectrum analyzers often come with limited dynamic range, modest amplitude accuracy, slower sweep speed, fragile inputs, and mysterious little spurs that appear like ghosts at a haunted electronics bench.
This guide explains how to deal with a cheap spectrum analyzer in a practical, realistic, and slightly humorous way. You will learn how to set it up, protect it, interpret what you see, avoid common measurement traps, and squeeze useful results out of budget gear without pretending it is a $40,000 instrument wearing a discount hoodie.
What a Spectrum Analyzer Actually Shows You
A spectrum analyzer displays signals by frequency and amplitude. On the horizontal axis, you see frequency. On the vertical axis, you see signal level, usually in dBm. Instead of showing voltage over time like an oscilloscope, it shows where energy exists across a selected frequency range.
That makes it perfect for answering questions such as: Is my oscillator really at 100 MHz? Is there a strong signal near my wireless microphone band? Does my amplifier produce harmonics? Is my switching power supply spraying noise everywhere like an RF confetti cannon?
However, a spectrum analyzer does not automatically tell you everything. It does not always identify the source of a signal. It does not prove a device is compliant with regulations. It does not magically fix bad grounding. And unless you have a real-time analyzer or a wideband SDR setup, very short burst signals may be missed during a slow sweep.
Why Cheap Spectrum Analyzers Are So Useful
The biggest advantage of a cheap spectrum analyzer is simple: it gets you looking. In RF work, guessing is dangerous. Many problems are invisible until you see the spectrum. A low-cost analyzer lets hobbyists, students, technicians, and small repair shops explore signals that would otherwise remain theoretical.
They Are Great for Learning
For beginners, a cheap spectrum analyzer is an excellent teacher. You can connect a signal generator, change frequency, adjust amplitude, and watch the trace respond. You can compare a clean sine wave to a square wave and see harmonics appear. You can place an antenna nearby and discover how crowded the RF world really is.
They Are Useful for Quick Checks
Need to confirm that a transmitter is producing output? Want to see if a filter is roughly doing its job? Trying to locate a strong interfering signal? A cheap analyzer may be good enough for fast troubleshooting. It may not give metrology-grade accuracy, but it can often show whether the problem is obvious, subtle, or currently laughing at you from the noise floor.
They Are Portable
Small analyzers fit in a backpack, tool case, or field kit. That makes them handy for antenna work, wireless audio setup, ham radio experiments, IoT testing, and classroom demonstrations. A big bench analyzer is wonderful, but it is less wonderful when you need to climb behind a rack or walk around a venue.
The Main Limitations You Must Respect
The first rule of cheap spectrum analyzers is this: respect the limitations before you trust the numbers. Low-cost instruments can be genuinely helpful, but they are not magic. They have trade-offs.
Limited Dynamic Range
Dynamic range describes how well the analyzer can handle strong and weak signals at the same time. A professional analyzer may reveal tiny signals near much larger ones. A cheap analyzer may overload, compress, or hide weak signals in noise. If a strong local signal is present, the display may show false peaks or raise the apparent noise floor.
Amplitude Accuracy Is Often Modest
Cheap analyzers can show relative differences fairly well, especially after calibration, but absolute power readings may be off by a few dB or more. That matters if you are measuring transmitter output, filter loss, or harmonic levels. For serious power measurement, use a calibrated power meter or a trusted reference setup.
Input Protection Is Not Optional
Many budget analyzers have fragile RF inputs. Applying too much RF power or DC voltage can damage the front end. If you are connecting anything stronger than a tiny signal source, use external attenuators, DC blocks, and common sense. Common sense is cheaper than replacing burned RF hardware.
Spurious Signals and Aliasing Can Confuse You
Low-cost devices may show internal spurs, mixer products, images, or aliasing artifacts. These are signals generated by the measurement system itself, not necessarily by your circuit. If a mysterious peak moves strangely when you change span, attenuation, or center frequency, it may be an instrument artifact.
How to Set Up a Cheap Spectrum Analyzer Correctly
Good measurements start before you touch the “scan” button. A cheap analyzer needs careful setup because it has less performance margin than expensive equipment.
Start with a Safe Signal Level
When in doubt, add attenuation. A 10 dB or 20 dB SMA attenuator can save your analyzer from accidental overload. If you are measuring a transmitter, never connect it directly unless you are absolutely certain the power level is safe. Use a dummy load, directional coupler, or high-power attenuator rated for the job.
Use a DC Block When Needed
If the device under test may have DC voltage on the RF line, add a DC block. Many analyzer inputs are designed for RF, not surprise DC. Surprise DC is rarely a pleasant surprise.
Choose the Right Span
Do not scan from DC to daylight when you only need to inspect a narrow band. A wide span is useful for discovery, but it reduces detail and can slow the sweep. Once you find the area of interest, narrow the span around the signal.
Set Center Frequency and Reference Level
Put the signal in the middle of the screen when possible. Set the reference level high enough to avoid overload but low enough to see detail. If the peak is smashed against the top of the display, you are not measuring; you are watching your analyzer complain.
Understanding RBW, VBW, and Sweep Speed
Resolution bandwidth, or RBW, is one of the most important spectrum analyzer settings. It controls how finely the analyzer separates nearby signals. A narrower RBW can reveal smaller details and lower the displayed noise floor, but it usually makes sweeps slower.
Video bandwidth, or VBW, smooths the displayed trace after detection. A lower VBW can make noisy traces easier to read, but too much smoothing can hide fast-changing behavior. Think of VBW like turning down the drama knob on a noisy display.
Sweep speed matters because the analyzer needs time to measure each frequency range properly. If the sweep is too fast for the selected RBW, readings may become inaccurate. Many budget analyzers automate some of this, but understanding the trade-off helps you avoid silly mistakes.
Cheap Spectrum Analyzer vs. SDR Dongle
Many people use software-defined radio devices as inexpensive spectrum viewers. An SDR can be fantastic for exploring radio signals, viewing waterfalls, and identifying active channels. However, an SDR dongle is not the same thing as a calibrated spectrum analyzer.
Most low-cost SDRs are receive-only devices with limited dynamic range and limited amplitude accuracy. They can show relative signal strength and spectral activity, but they are usually poor choices for precise power measurements. Strong signals can overload the ADC, and front-end filtering may be minimal. Still, for learning and signal hunting, an SDR is often the best “cheap window” into the RF world.
A handheld spectrum analyzer, on the other hand, may provide dedicated RF attenuation, sweep functions, markers, and a measurement-focused interface. It may still be limited, but it is often easier to use for quick field checks.
Practical Uses for a Low-Cost Spectrum Analyzer
Finding Interference
One of the best uses is interference hunting. Connect an antenna and scan the band of interest. Look for unusually strong signals, unexpected carriers, or bursts that appear when a device turns on. You may discover that the mysterious problem is caused by a nearby transmitter, a noisy power supply, or a gadget that has decided to become a tiny radio station.
Checking Harmonics
If you generate a signal at one frequency, harmonics may appear at multiples of that frequency. For example, a 100 MHz signal may produce energy at 200 MHz and 300 MHz. A cheap analyzer can help you see obvious harmonics, though accurate compliance testing requires calibrated equipment and proper procedures.
Testing Filters
With a tracking generator or external signal source, you can estimate filter response. You send a swept signal through the filter and observe what comes out. This is useful for checking low-pass, high-pass, band-pass, and notch filters. Just remember that cables, adapters, source flatness, and analyzer accuracy all affect the result.
Comparing Antennas
You can use a cheap analyzer to compare received signal levels from different antennas. This is not the same as measuring antenna gain in a controlled chamber, but it can show practical differences. Keep the setup consistent: same location, same orientation, same frequency, same cable, and same distance from the signal source.
How to Avoid False Confidence
The most dangerous cheap spectrum analyzer is not the inaccurate one. It is the inaccurate one that you believe completely. A display with numbers and markers feels official, but every reading depends on setup, calibration, bandwidth, input level, and instrument limits.
Use Known References
Test your analyzer with a known signal source. If you have a calibrated signal generator, great. If not, use the most stable and predictable source available. Learn how your analyzer behaves at different frequencies and power levels.
Change Settings and See If the Signal Makes Sense
If a peak is real, it should behave logically when you change span, attenuation, RBW, or input connection. If it disappears when you add attenuation, shifts oddly when you move the center frequency, or remains when the input is terminated, be suspicious.
Use a 50-Ohm Terminator
A 50-ohm terminator is a small but powerful troubleshooting tool. Attach it to the analyzer input and observe the noise floor. Any persistent peaks may be internal spurs or environmental pickup through shielding. This simple check can prevent hours of chasing imaginary signals.
Accessories That Make Cheap Analyzers Better
A cheap analyzer becomes much more useful with a few affordable accessories. You do not need a royal treasure chest of RF adapters, but you do need the basics.
External Attenuators
Buy 10 dB, 20 dB, and possibly 30 dB attenuators with the correct connector type and power rating. They protect the input and help improve measurement behavior when signals are too strong.
DC Block
A DC block protects the analyzer from unwanted DC voltage. Use it whenever the source might include bias voltage, phantom power, or unknown circuit conditions.
Good Coaxial Cables
Cheap, damaged, or poorly shielded cables can ruin measurements. Use short, decent-quality coaxial cables with solid connectors. At higher frequencies, cable loss becomes more important.
Adapters and Connector Savers
SMA connectors are not indestructible. Use connector savers or short adapter cables if you frequently connect and disconnect devices. Replacing a worn adapter is much easier than repairing the analyzer’s RF input.
Common Mistakes Beginners Make
Measuring Too Much Bandwidth at Once
Wide scans are tempting, but they often hide details. Start wide to locate activity, then narrow the span for analysis.
Ignoring Overload
If the analyzer overloads, the screen may show false signals. Add attenuation and check again. Overload is the RF equivalent of trying to judge a song while standing inside the speaker cabinet.
Trusting Absolute Power Too Much
Cheap analyzers are best for trends, comparisons, and troubleshooting. Treat absolute dBm readings as approximate unless you have verified the setup.
Forgetting the Antenna Is Part of the Measurement
When using an antenna, you are measuring the antenna, the environment, reflections, orientation, polarization, and the signal. Move the antenna slightly and the result may change. That does not mean the analyzer is broken; it means RF is being RF.
How to Get Better Results From Budget Gear
First, calibrate or normalize when your device supports it. Second, keep notes. Record frequency, span, RBW, attenuation, reference level, cable type, and setup. Third, repeat measurements. If the same result appears under similar conditions, confidence improves.
Fourth, compare rather than worship. Instead of asking, “Is this exactly -47.3 dBm?” ask, “Did this filter reduce the signal by about 20 dB compared with bypass?” Relative measurements are often more reliable than absolute ones on inexpensive equipment.
Finally, know when to stop. If you are testing regulatory compliance, transmitter purity, phase noise, occupied bandwidth, or safety-critical equipment, use professional calibrated instruments or a qualified test lab. A cheap analyzer is a useful guide, not a legal witness in a lab coat.
Real-World Experience: Lessons From Using a Cheap Spectrum Analyzer
After spending time with budget spectrum analyzers, the first lesson is humility. The display looks scientific, the markers feel precise, and the numbers invite confidence. Then you change the RBW, move the cable, add 10 dB attenuation, and suddenly the “very serious” signal has changed its personality. That is when you realize the analyzer is not just showing the device under test. It is showing the entire measurement setup.
One practical experience is checking small RF modules. Suppose you are working with a 433 MHz remote-control transmitter. A cheap analyzer can quickly confirm that something appears near the expected frequency. You can press the button, see a burst, and compare one remote to another. That is useful. But if you try to certify output power or guarantee spectral purity from that same quick scan, you are stretching the tool beyond its comfort zone. The analyzer can tell you, “Yes, there is RF energy here.” It may not be able to tell you, “Yes, this product passes a formal compliance test.”
Another experience is chasing interference. A handheld analyzer with a small antenna can help identify whether a band is quiet or crowded. Walk around a room, rotate the antenna, and watch the signal strength change. Sometimes you find the culprit quickly: a noisy LED driver, a wireless device, a bad power adapter, or a transmitter too close to sensitive equipment. Other times, reflections make the signal seem to come from everywhere. RF has a talent for turning buildings into puzzle boxes.
Cheap analyzers are also excellent for learning filters. Connect a signal source through a filter, observe the output, and you can see the basic passband and stopband behavior. The experience becomes much better if you normalize the setup or take a reference trace before inserting the filter. Without that step, you may accidentally measure cable loss, source variation, adapter problems, and filter response all mixed together in one confusing soup.
The most valuable habit is using attenuation generously. Many beginners are afraid attenuation will make signals harder to see. Sometimes it does, but it also prevents overload and reduces misleading artifacts. If a peak remains stable after adding external attenuation and adjusting the reference level, it is more likely to be real. If the display becomes cleaner after attenuation, the analyzer was probably struggling with too much signal.
A 50-ohm terminator is another underrated hero. Put it on the input and observe the display. This helps you understand the analyzer’s own noise floor and internal spurs. Once you recognize those built-in quirks, you stop blaming your circuit for every little bump on the screen. That alone can save an afternoon.
The final experience is psychological: a cheap spectrum analyzer works best when you treat it as a guide, not a judge. Use it to ask better questions. Use it to compare before and after. Use it to learn how RF systems behave. But when the measurement matters financially, legally, or technically, verify with better equipment. Budget gear is not embarrassing. Misusing it with expensive confidence is.
Conclusion
Learning how to deal with a cheap spectrum analyzer is really learning how to think like a careful RF troubleshooter. Budget analyzers are powerful learning tools and practical problem-solvers when used with realistic expectations. They can reveal interference, harmonics, rough filter behavior, antenna differences, and unexpected signals. They can also mislead you if you ignore input limits, dynamic range, RBW, attenuation, calibration, and setup quality.
The smartest approach is simple: protect the input, narrow the span, use attenuation, verify with known references, distrust mysterious peaks, and focus on repeatable comparisons. A cheap spectrum analyzer may not replace a professional lab instrument, but in the hands of a patient user, it can turn invisible RF problems into visible clues. And that is a pretty good deal for a small box with a screen.